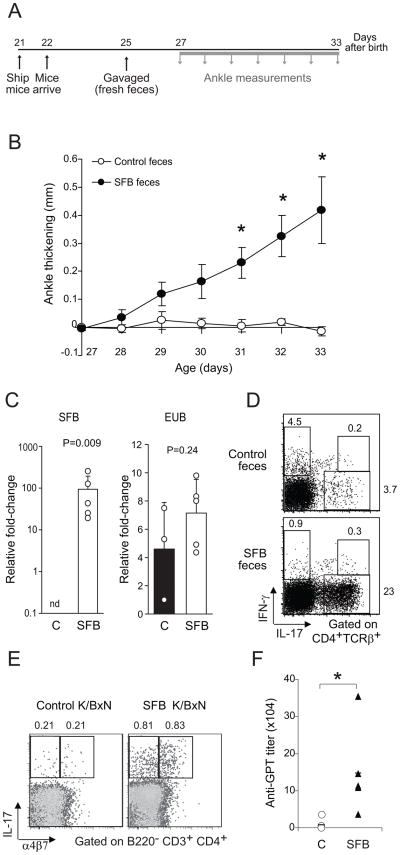
Figure 7. Triggering of arthritis in SFB-colonized GF K/BxN mice.
(A) Experimental scheme. Mice were shipped from the GF Taconic facility to the SPF NYU facility on day 21 after birth and arrived the next day. After a 3-day rest; they were gavaged with SFB mono-feces or control GF feces (the rare animal with already swollen ankles was not used). Ankle thickening was measured every day from day 27 to day 33. (B) Measurement of ankle thickness beginning on day 27. N=9 for SFB-treated and N=5 for controls from 4 independent experiments. Asterisks indicate statistical significance using the Student s t-Test, *P<0.05. (C) Quantitative PCR analysis of SFB and total bacterial (EUB) 16S rRNA genes in mouse feces. GF K/BxN mice were gavaged either with their own feces (C) or with feces from SFB mono-colonized mice (SFB). Genomic DNA was isolated from fecal pellets on day 6 after gavage. Data combined from two separate experiments. (D) SI-LP lymphocytes were isolated from control or SFB- inoculated K/BxN mice. Cells were stained and analyzed by flow cytometry. Expression of IL-17 versus IFN-γ is plotted. Values refer to % of the gated population in total CD4+TCRβ+ cells. (E) Splenocytes were isolated from control or SFB-inoculated K/BxN mice, and were stained and analyzed by flow cytometry, gated as indicated. Plots depict IL-17 versus α4β7 staining. Values indicate % of IL-17+α4β7+ or IL-17+α4β7− cells in total CD4+ T cells (B220− CD3+CD4+). Data are representative of two independent experiments. (F) Sera were collected from control or SFB-inoculated K/BxN animals at the end of the experiment depicted in panel A. The bar indicates the mean. Asterisks indicate statistical significance using the Student s t-Test, *P<0.05.

