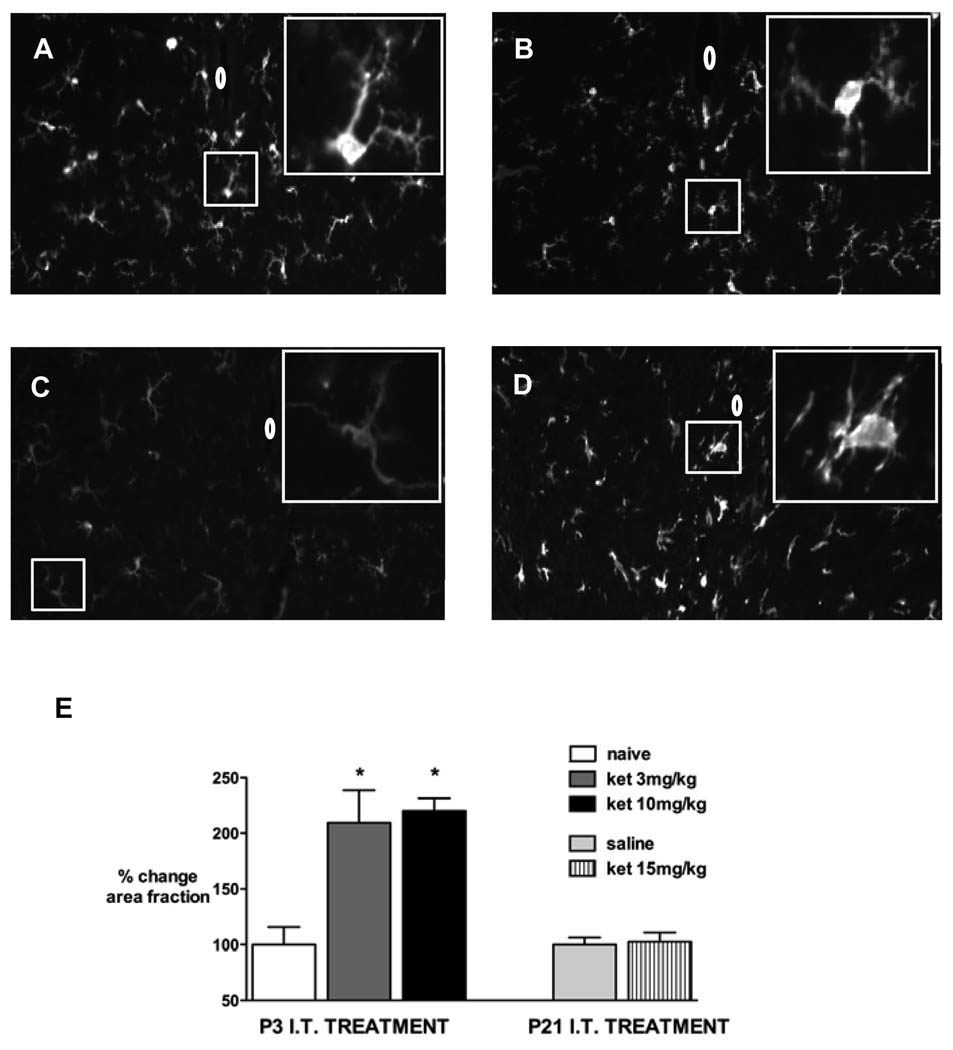
Figure 5.
Representative spinal cord sections showing ionized calcium binding adapter molecule 1 (Iba1) immunoreactivity in the spinal cord 7 days following: P3 intrathecal (IT) injection of ketamine (ket) 3 mg/kg (A) or ketamine 10 mg/kg (B). Images are also shown from a naive age-matched P10 pup (C) and 3 days after intraspinal n-methyl-D-aspartate (NMDA) injection (D). Insets show high power magnification of microglia; 0 = position of central canal.
E: Immunofluorescence represented as % change in positive area fraction compared with control animals (naïve in P3, n = 3 and saline injection in P21, n = 3) 7 days after ketamine (ket) 3 mg/kg (n = 3) or ketamine 10 mg/kg (n = 4) at P3 or ketamine 15 mg/kg (n = 3) at P21. * P < 0.05 one-way ANOVA with Bonferroni post-hoc comparisons versus control.

