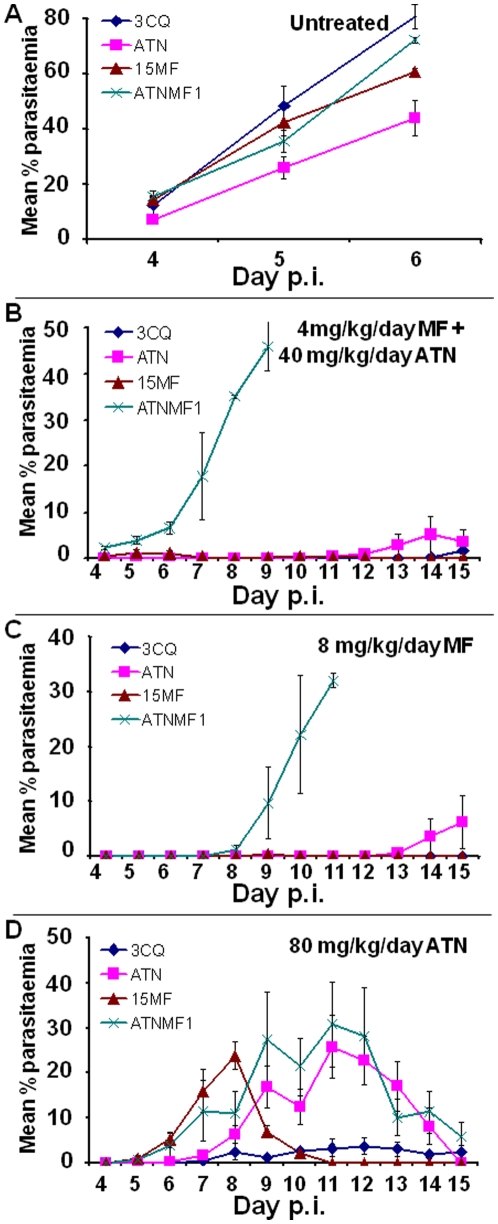
Figure 3. Drug test results.
Each line represents the evolution of parasitaemia in each parasite clone from day 4 post-inoculum (p.i) in the absence of treatment (a), under artesunate + meloquine treatment (b), under mefloquine treatment (c) or under artesunate treatment (d). Each data point is a mean of % parasitaemias ± SE resulting from reads of groups of two and five mice in the untreated and treated groups, respectively.

