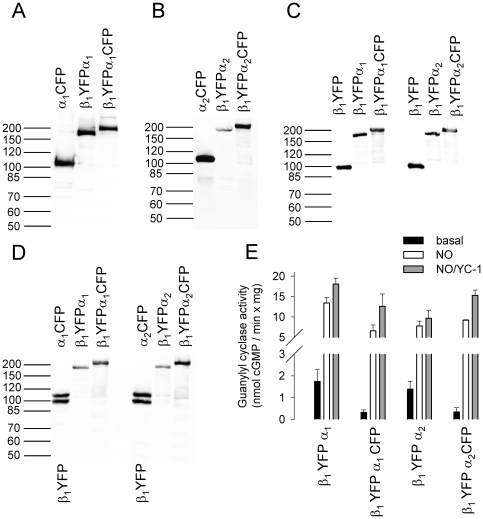
Figure 5. Analysis of fluorescent-conjoined sGC in cytosol of infected Sf9 cells.
Western blot analysis with antibodies against the α1 subunit (A) α2 subunit (B) β1 subunit (C) and fluorescent protein (D). Specific sGC activity of the fluorescent-conjoined sGC variants (E). Data are mean ± S.E. of three independent experiments performed in duplicate.

