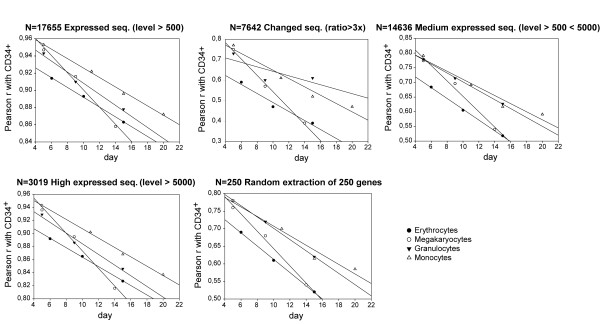
Figure 4.
Correlation between HPCs and hematopoietic cells at different stages of differentiation. The different panels report the Pearson correlation (r) between CD34+ progenitor cells and the different lineages at subsequent differentiation time points. The progressive advancement of differentiation provokes a linear decrease of correlation in time. The substantial homogeneity of the graphs with different gene subsets points to the scalable character of the trajectories towards the final attractors.

