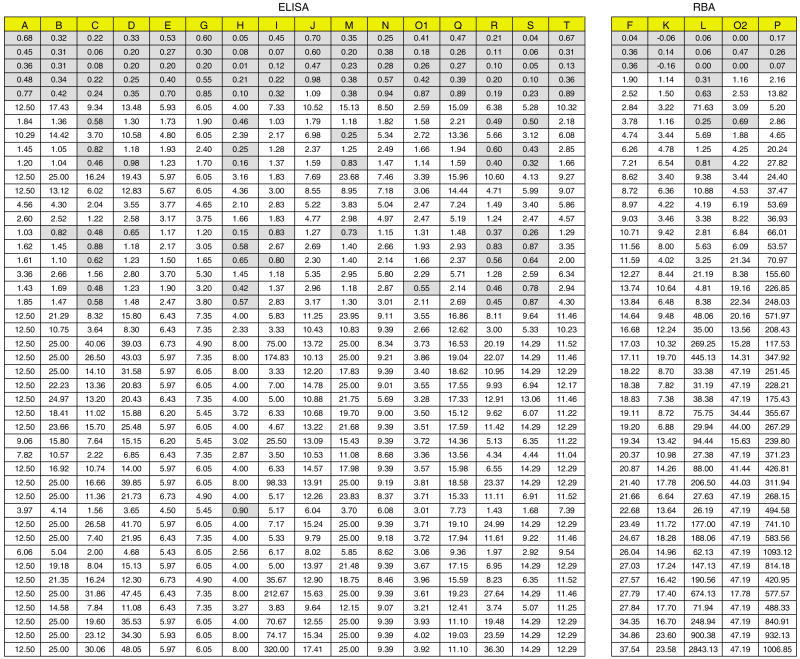
Figure 2.
A graphic representation of all of the celiac sera (excluding the diluted samples) in the workshop, organized by laboratories performing ELISA (group on left, n=16) or RBA (group on right, n=5) in columns. All values are normalized to “1” by dividing the TGAA level by the assay's cutoff, such that a number >1 is interpreted as positive (clear box) and a number <1 is interpreted as negative (shaded box) by that assay. Sera are arranged from top to bottom in order of increasing normalized TGAA value according to the reference laboratory.

