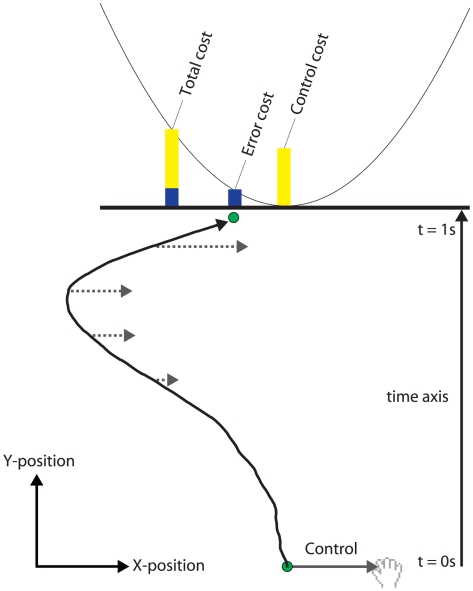
Figure 1. Schematic of the task.
Subjects attempted to move a virtual ball (represented by the green circle) to the center of a target line (represented by the black horizontal line). The ball moved with constant y-velocity and hit the target after 1 s, whereas it moved with Brownian motion in the x-direction. Final positional errors were penalized by a quadratic cost function that was displayed as a parabola and the error cost was displayed at the end of the trial (blue bar). Subjects could exert control on the x position of the ball by moving their hand to the left or right (gray solid and dashed arrow lines). This incurred a control cost which was the quadratic in the control signal and the cumulative across a trial (yellow bar) was constantly displayed. At the end of the trial subjects received feedback of the total cost, the sum of control and error cost (yellow-blue bar). Subjects were required to minimize the total cost on average and were tested on four conditions (2 noise levels×2 control cost levels). The path taken by the ball is shown for a typical trial.

