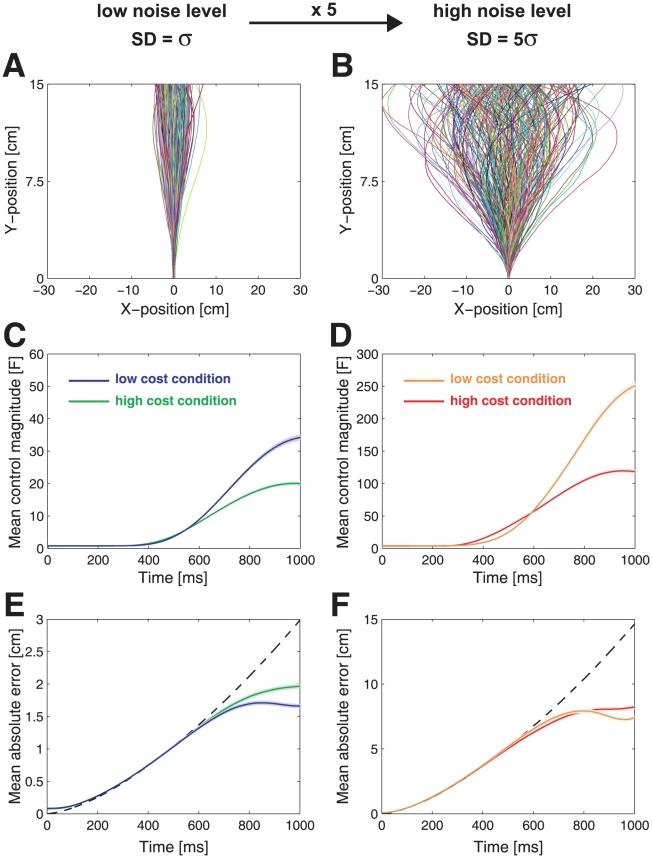
Figure 2. Task performance.
A. All 250 ball paths for a typical subject for the low noise level (high control cost condition). Individual trials are colored randomly. B. as A. but for the high noise level. C. Mean control magnitude across all trials and subjects for the low noise level (blue - low cost condition, green - high cost condition). D. as C. but for the high noise level (yellow - low cost condition, red - high cost condition). E. Mean absolute positional error (absolute deviation from the center of the target line) across all trials and subjects for the low noise level (colors as in C.) The dashed line shows the mean absolute error if subjects did not intervene. F. as E. but for the high noise level. Note that the y-scale in D. and F. is five times greater than in C. and E. due to the higher noise level. Shaded area shows one s.e.m. across all trials.

