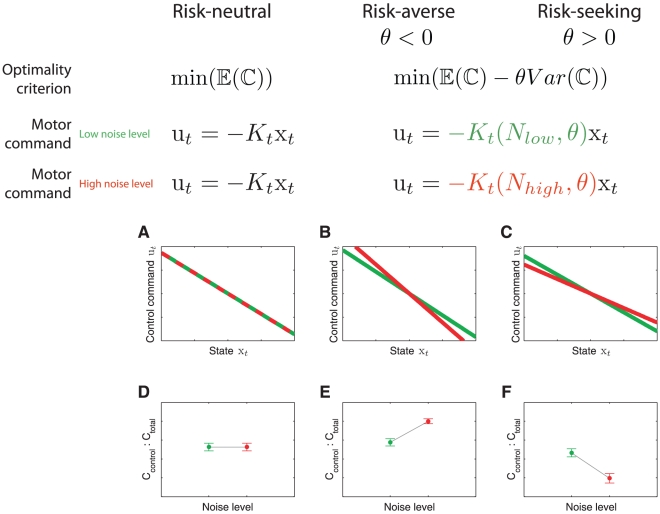
Figure 3. Predictions of optimal feedback control models.
A risk-neutral optimal control model [4], [17] attempts to minimize the mean of the cost function. As a result, its policy (that is the motor command applied for a given state of the world) is independent of the noise variance N. In contrast, a risk-sensitive optimal control model [22], [34] minimizes a weighted combination of the mean and variance of the cost. Additional variance is an added cost for a risk-averse controller ( ), whereas it makes a movement strategy more desirable for a risk-seeking controller (
 ). As a consequence, the policy of the controller changes with the noise level N depending on its risk-attitude
  . A.–C. Changes in motor command with the state of the ball (its positional deviation
  from the center) for a low noise level (green) and for a high noise level (red) for the risk-neutral (A), risk-averse (B) and risk-seeking (C) controllers. The slope of the lines is equivalent to the control gain of the controller. D.–F. Contribution of control cost to total cost (control cost+error cost) for the risk-neutral (D), risk-averse (E) and risk-seeking (F) controllers.

