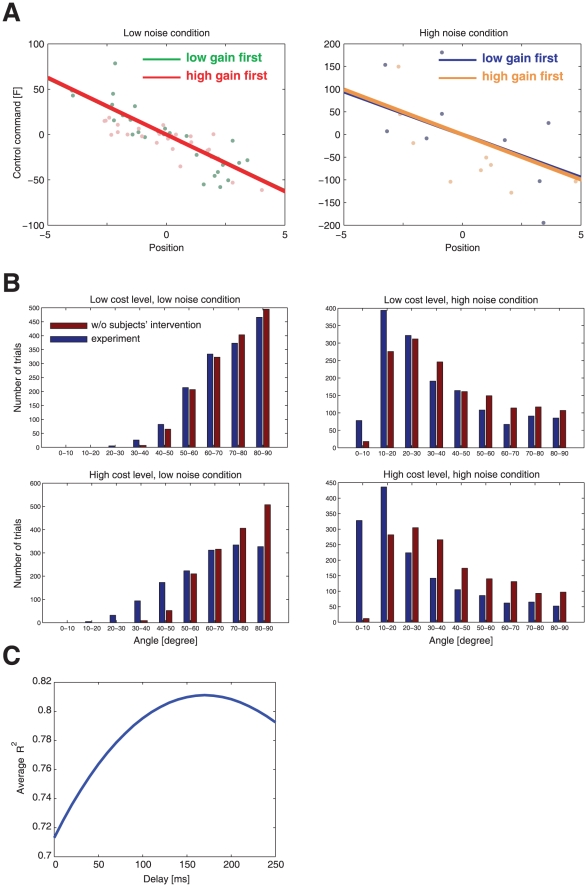
Figure 6. Analysis of possible confounds and sensorimotor delay.
A. Results of the multilinear regression analysis of the first 15 trials for the low and the high noise condition. The subjects' data was pooled according to whether they began the experiment with a low gain or with a high gain (green and blue - low gain first; red and yellow - high gain first). B. Number of trials for different angles of the velocity vector of the ball with the wall upon impact (dark red - hypothetical impact angle of the ball had the subjects not intervened, dark blue - actual impact angle during the experiment). C. R -values of the multilinear regression analysis averaged across all subjects and conditions for different sensorimotor delays.

