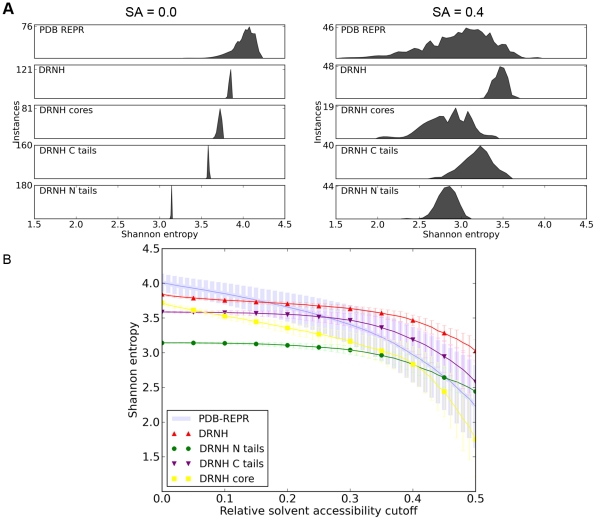
Figure 4. Analysis of sequence Shannon entropy of DRNH.
A) Distributions of sequence Shannon entropy at solvent accessibility cutoffs of 0.0 and 0.4. B) Average sequence Shannon entropy at different solvent-accessibility cutoffs for nudix hydrolase, its core, tails, and the PDB representative set. The error bars are standard deviations from the average entropy of a given set.

