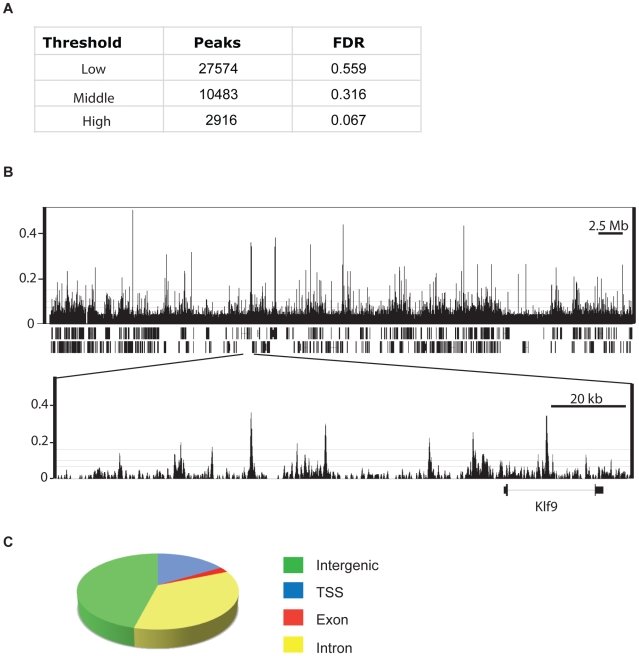
Figure 1. CHD7 ChIP–Seq analysis in mouse ES cells.
(A) Total number of ChIP-Seq peaks representing genome-wide CHD7 binding sites at three thresholds and corresponding false-discovery rates (FDR). (B) Integrated Genome Browser view of mapped sequence tags from CHD7 ChIP-Seq analyses with low, medium, and high thresholds shown as horizontal lines. (top panel) Data from mouse chromosome 19. (bottom panel) Zoomed view of individual CHD7 ChIP-seq peaks. (C) Pie chart depicting the location of CHD7 binding sites relative to known genes (mm8 assembly).

