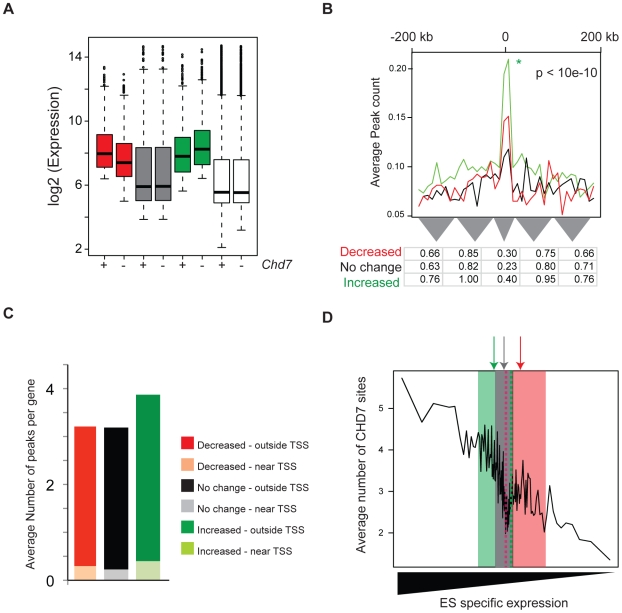
Figure 6. CHD7 modulates ES cell specific expression.
(A) Distribution of gene expression in wild type (+) and CHD7 null (−) ES cells. Genes were defined as decreasing (red, n = 800), increasing (green, n = 1200), or not changing (gray, n = 1000) upon loss of CHD7. The white boxplots represent the genome-wide distribution of gene expression in either wild type or Chd7 null ES cells. (B) CHD7 is significantly enriched near genes that increase in expression upon loss of CHD7. The P-value reflects significance of CHD7 enrichment of differentially increased genes (green) compared to non-differentially expressed genes (black). Comparisons between differentially decreased genes (red) and non-differentially expressed genes were insignificant. Similar results are obtained when CHD7 sites are correlated to smaller gene sets containing the top 100, 200, or 400 differentially expressed genes (data available upon request). (C) Average number of CHD7 binding sites per gene for each gene set. CHD7 sites located near TSSs are distinguished from those located distal to TSSs. (D) To determine whether differentially expressed genes are ES cell specific, genes in each of the 3 classes above were scored according to the specificity of their expression in ES cells, as compared to NP and MEFs. The distribution of the ES-specificity scores for genes in each of the 3 sets was then superimposed on the plot from Figure 4D. Note that ES cell specificity scores for genes that increase upon loss of CHD7 (green) are located on the left side of the plot, compared to genes that either decrease (red) or are not differentially expressed (gray). Arrows correspond to median specificity scores for each gene set.

