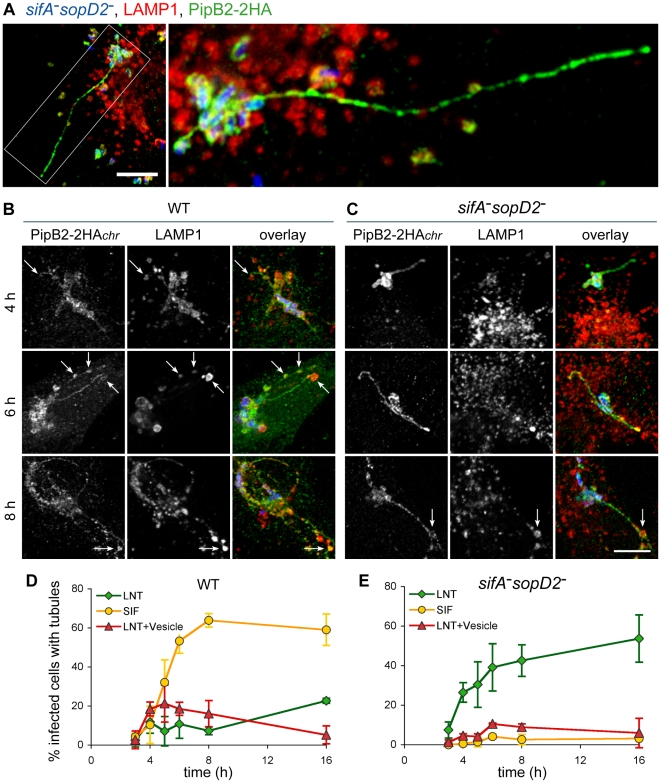
Figure 9. Structure and kinetics of formation of LNTs.
HeLa cells were infected with GFP-expressing wild-type or sifA−sopD2 strains (blue) and immunostained for LAMP1 (red) and PipB2-2HA (green) expressed from the chromosome. Images in (A) present a cell infected for 16h with the sifA−sopD2− mutant strain. The right image is the delineated zone magnified 3 times. LNTs as long as 30–40 µm were observed. Scale bar, 10 µm (left image) and 3,3 µm (right image). (B to C) Cells were fixed at 4, 6 and 8 h, and imaged. Short LNTs were observed as early 4 h p.i.. LNTs contacting LAMP1-positive vesicles were frequently observed (arrows in B and C). Scale bar, 10 µm. (D and E) LNTs, LNTs contacting LAMP1-positive vesicles and SIFs were scored at different time-points. Values are mean ± SD of 3 independent experiments.

