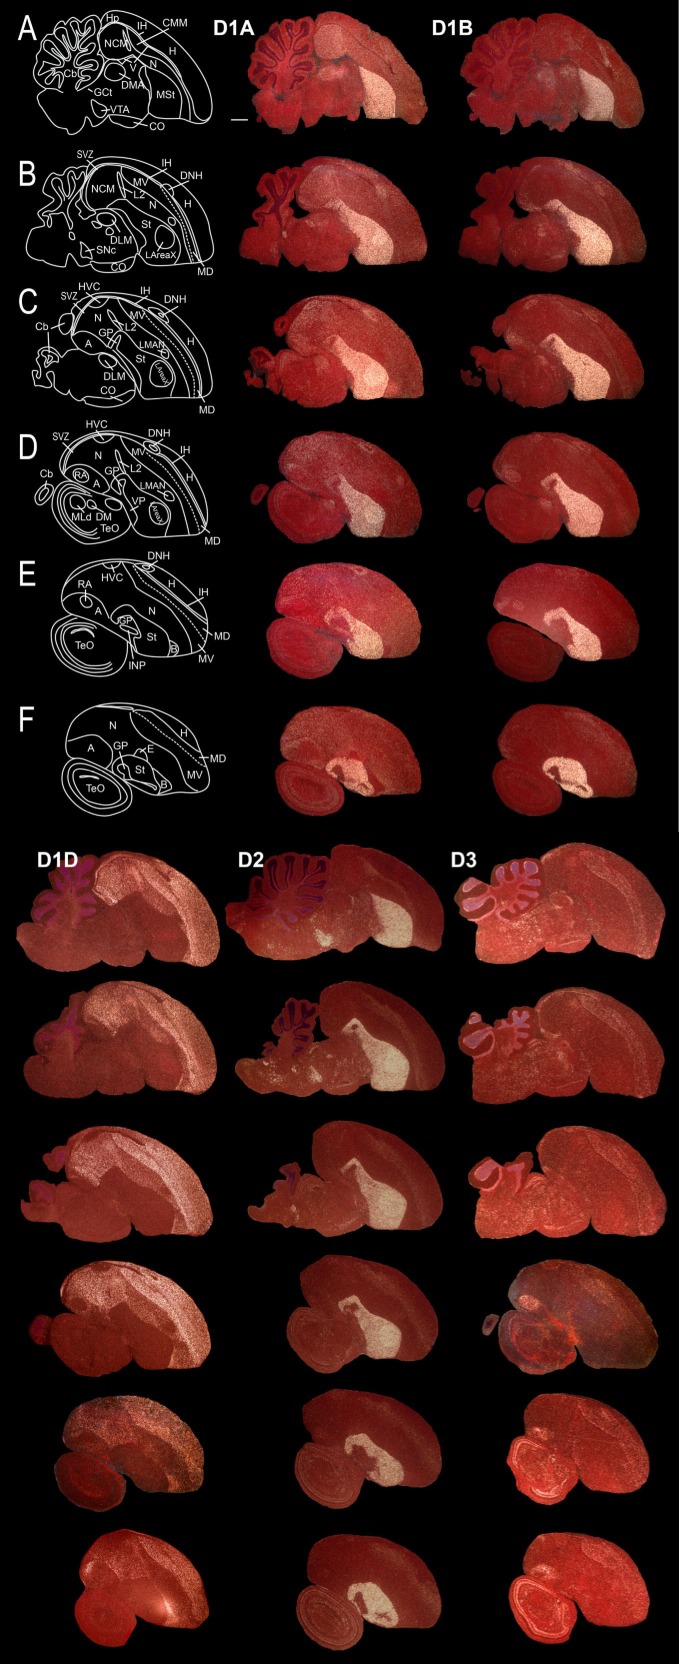
Figure 4.
Expression profiles of dopamine receptor types in sagittal series from adult male zebra finch brain. A–F: Rows showing medial to lateral series across two pages of this report with the respective drawings on the left. Columns are labeled on the top for each receptor (D4 pattern is shown separately in Fig. 6). The images were taken under darkfield microscopy. White silver grains, dopamine receptor mRNA expression; red, cresyl violet stain. Rostral is right, dorsal is upward. The sequences of the cDNA probes used are in Genbank (accession Nos. AB372107, AB372108, AB372109, AB3490795, AB327111, for D1A, D1B, D1D, D2 transcript variant 1, and D3 respectively; Table 1). Scale bar = 1 mm.

