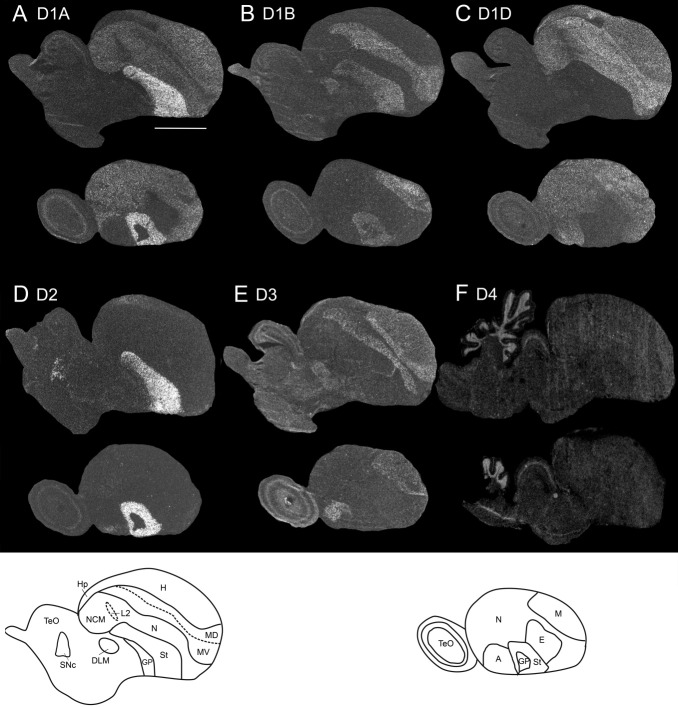
Figure 9.
Expression profiles of dopamine receptor subtypes in adult chicken brain. Images were taken from film autoradiograms and inverted; white, mRNA signal. Two sagittal sections are shown per receptor; the distance from the midline is ∼1.5 (top) and 3.5 mm (bottom). A–C show the D1 receptor family (D1A, D1B, and D1D). D–F show the D2 receptor family (D2, D3, and D4). The hybridizations were done with the zebra finch 35S-UTP-labeled cRNA riboprobes using the same high-stringency conditions as for the zebra finch in situ hybridizations. Scale bar = 0.5 cm.

