Figure 1.
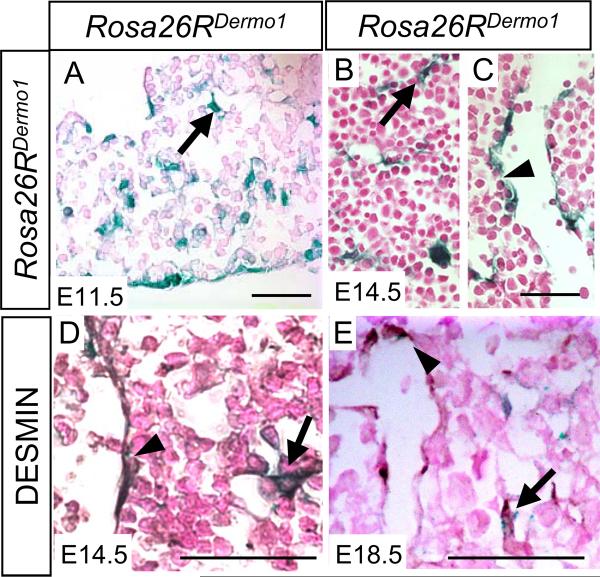
Spatial and temporal expression pattern of LacZ in Rosa26Dermo1 livers embryos during hepatogenesis at E11.5 (A) and E14.5 (B and C). Co-localization with the mesenchymal marker DESMIN (brown) and β-galactosidase activity (blue) at E14.5 (D) and E18.5 (E). Arrows indicates fibroblast-like cells with β-galactosidase activity distributed throughout the liver parenchyma and arrowheads indicate cells with β-galactosidase activity lining the sinusoids. Bars denote 25 µm.

