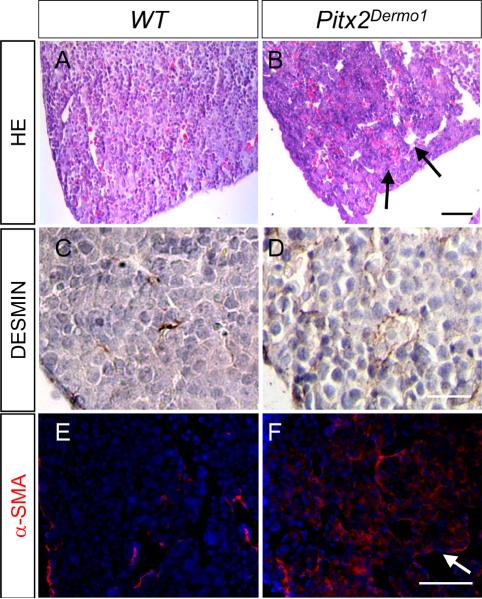
Figure 5.
Phenotype analysis of E14.5 Pitx2Dermo1. Hematoxylin and Eosin staining of Pitx2Dermo1 mice (B) and control littermates (A). Bar indicates 50 µm. Arrow indicates dilated sinusoids in the conditional knockout. Immunohistochemical staining for mesenchymal DESMIN (brown) (C, D) Bar denotes 25 µm. Immunofluorescent staining for mesenchymal αSMA (red) (E, F) show increased staining in conjunction with dilated blood vessels in Pitx2Dermo1 livers compared to control littermates (E, F arrow). Bar denotes 50 µm (C, E).

