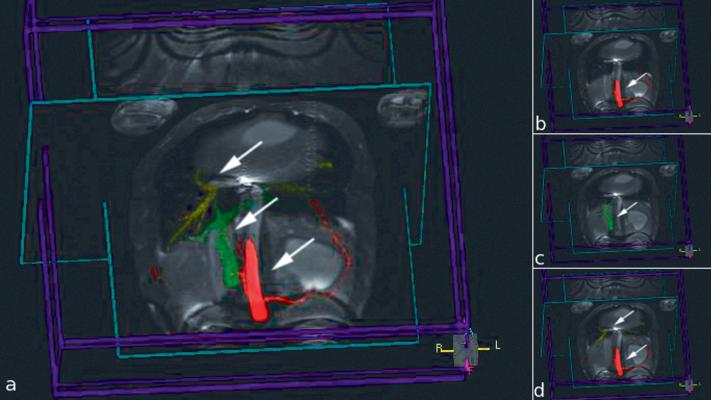
Figure 1.
Image captures from the 3D rendering for use in MRI-guided TIPS experiment showing multiple colorized MIPs rendered with two orthogonal real-time image slices. Each MIP is indicated by an arrow. a) All MIPs are visualized. b) Only hepatic artery (red) is shown c) Only portal vein (green) is shown. d) Hepatic artery (red) and hepatic vein (yellow) are grouped and shown.

