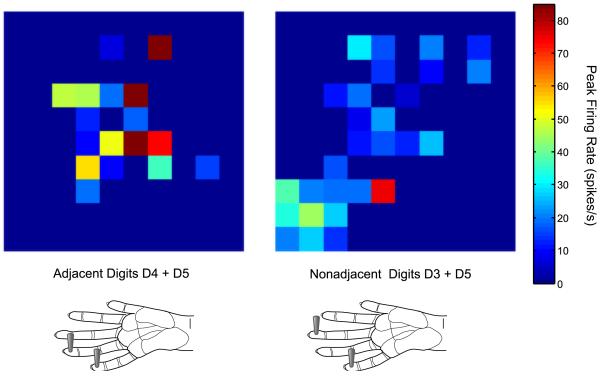
Fig 1. Snapshots of activity recorded from a 100-electrode array under two different stimulation conditions.
Activity snapshots were plotted in color maps of the peak firing rate measured across the 10 × 10 electrode array in monkey 3. Each square represents an electrode in the array and the color indicates the peak firing rate value during the 50 ms response window. Electrodes from which no significant responses (firing rate increases over baseline) were obtained during the stimulations shown are indicated in dark blue (no squares). The lower schematics indicate the locations of the stimulus probes on the owl monkey hand. Left panel shows the activity when adjacent digit locations on digit 4 (D4) and digit 5 (D5) were stimulated simultaneously (0 ms temporal onset asynchrony). Right panel shows the activity when nonadjacent digit locations on digit 3 (D3) and D5 were stimulated simultaneously. Differences between the patterns of activity during the two stimulation conditions are obvious and can easily be described visually, but quantitative measures are desired.

