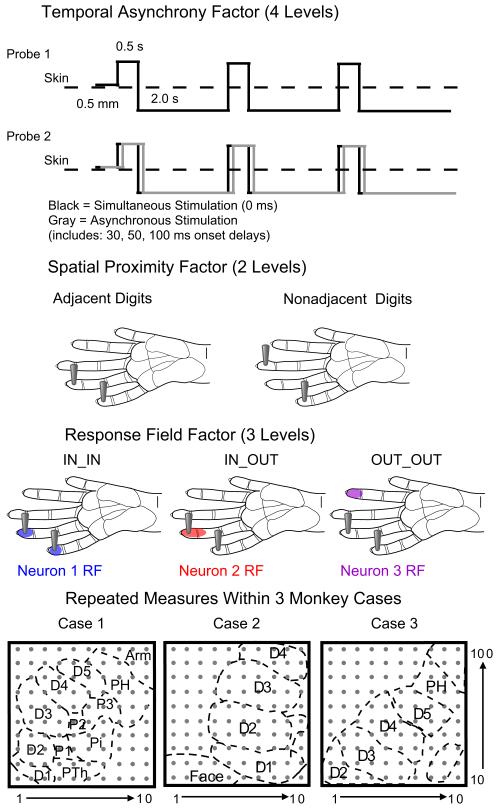
Fig 2. Schematic of factors evaluated in the example data set.
The categorical factors related to the stimulus parameters and the experimental subjects are shown with schematics to represent the levels over which the categories vary. The temporal stimulation asynchrony factor involves the relationship between the onset of stimulation by two tactile probes. The gray line represents how the onset of the second stimulation can be delayed in time relative to the onset of the stimulus provided by probe 1. The spatial proximity factor relates to the location of the two tactile probes on the hand. The Response Field factor categorizes the relationship of the stimulus probes to the Response Fields of each neuron. The final factor categorizes the data from which monkey case the signals were recorded. Schematic representations of the location of the 100-electrode array relative to the hand representation in primary somatosensory cortex (area 3b) are shown to designate each monkey case. (D = digit; P = palm pad; Th = thenar; H = hypothenar; i = insular.)

