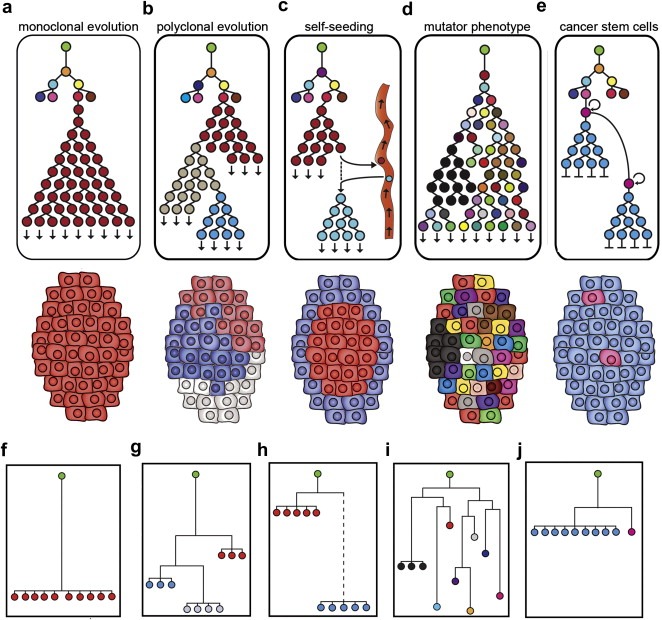
Figure 1.

Tumor progression models and lineages. Green root nodes represent normal diploid cells, colored nodes are different tumor clones. (a–e) Models for tumor progression and phylogenetic lineages. (f–j) Hypothetical neighbor‐joining (NJ) trees constructed using 10 copy number profiles from a single tumor. (a) Monoclonal evolution forms a monogenomic tumor (b) Polyclonal evolution forms a polygenomic tumor (c) Self‐seeding results in a tumor with a divergent peripheral subpopulation (d) Mutator phenotype generates a tumor with many diverse clones (e) Cancer stem cell progression results in a tumor with a minority of pink cancer stem cells (f) NJ tree of a monogenomic tumor (g) NJ tree of a polygenomic tumor (h) NJ tree of a self‐seeded tumor with a dotted line representing a large phylogenetic distance (i) NJ of a mutator phenotype tumor (j) NJ tree of a cancer stem cell tumor.
