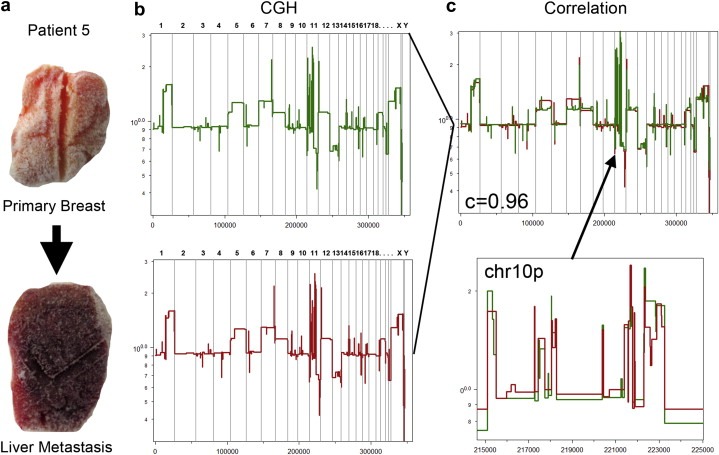
Figure 6.

Genomic progression in a metastatic breast cancer patient. (a) A frozen primary breast tumor and metastatic liver tumor resected from a single patient. (b) CGH profiles measured by Representational Oligonucleotide Microarray Analysis (ROMA). The segmented breast tumor profile is plotted in green and liver profile is plotted in red. (c) (Upper Panel) Segmented breast and liver profiles are plotted and a high Pearson's correlation was calculated (c = 0.96) between the copy number events. (Lower Panel) An enlarged region of Chromosome 10p is plotted showing the high similarity between complex rearrangements in the primary and metastatic tumors.
