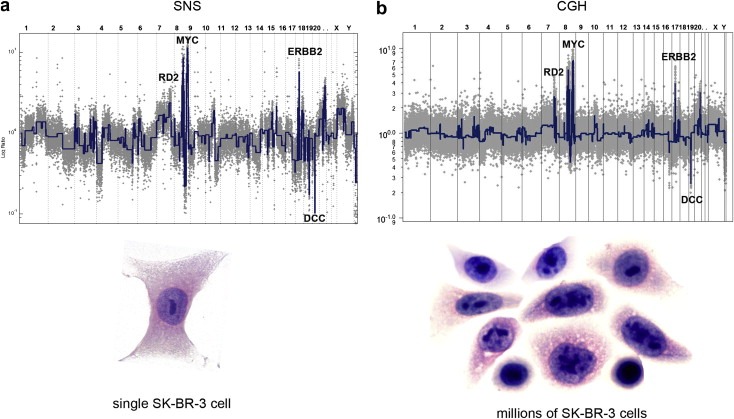
Figure 7.

Single cell vs. million cell copy number profiles. Single Nucleus Sequencing (SNS) was used to profile copy number in a single SK‐BR‐3 cell and microarray CGH was used to profile copy number in approximately one million SK‐BR‐3 cells. (a) Next‐generation sequencing was used to measure genome‐wide read depth in a single SK‐BR‐3 cell on one Illumina flowcell lane. Reads were counted in 50 kb intervals across the human genome to generate a copy number profile (gray) from which segments were calculated (blue). (b) CGH profile of one million SK‐BR‐3 cells. The copy number ratio data are plotted in gray and the segmented profile in blue.
