
Figure 1.
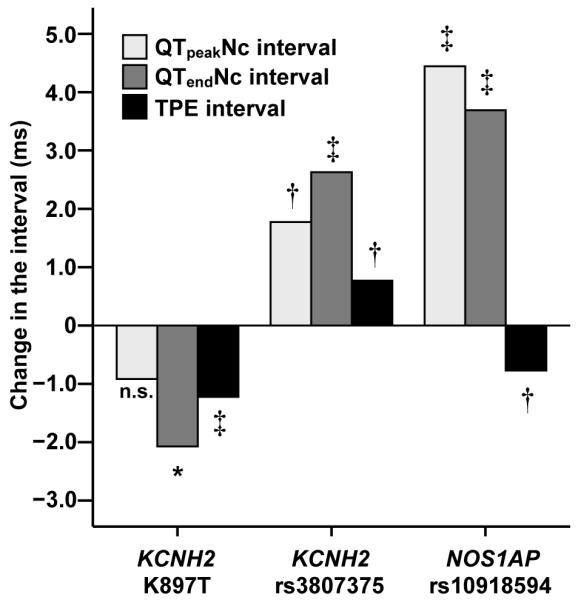
Effect of KCNH2 K897T, KCNH2 rs3807375, and NOS1AP 10918594 SNPs on electrocardiographic QTpeak, QTend, and TPE interval. Values are differences from major homozygotes per one minor allele. Because of similarity of the results for all other NOS1AP SNPs, results are shown only for rs10918594. *P<.05, †P<.01, ‡P<.0001. Nc=nomogram-corrected for heart rate, n.s.=nonsignificant, SNP=single-nucleotide polymorphism, TPE=T-wave peak to T-wave end.