
Figure 2.
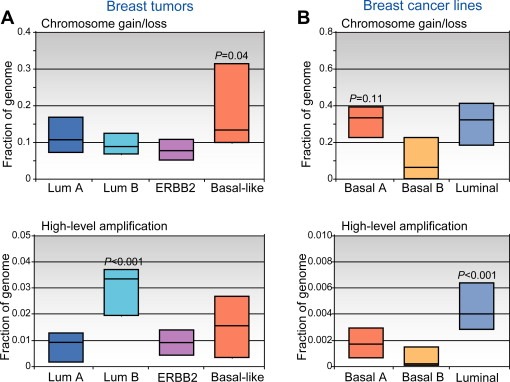
Molecular (gene‐expression) subtypes of breast cancer have been associated with distinct patterns of CNA. (A) Breast tumors classified by expression pattern (luminal A, luminal B, ERBB2, and basal‐like) display varying levels of low‐amplitude chromosome segment gain/loss (above), and of high‐level DNA amplification (below). Box plots display the 25th, 50th (median), and 75th percentiles of genome (cytoband) fraction altered among tumors classified (by expression profiles) to each subtype. Note that basal‐like tumors exhibit higher levels of segmental gain/loss, while luminal B tumors show more high‐level DNA amplifications (P‐values represent comparisons of the one group vs. all others). (B) Breast cancer cell lines, which can be classified by expression patterns to luminal or to one of either of two basal‐like groups (Neve et al., 2006; Kao et al., 2009), display analogous CNA patterns. Fraction of genome (genes) altered is displayed, as above. “Basal A” lines, which are most similar to basal‐like tumors (Kao et al., 2009), exhibit high levels of segmental gain/loss (P‐value compared to basal‐B group), while luminal lines show more high‐level DNA amplifications (compared to basal lines). Breast lines therefore provide a relevant model system to study the underlying genomic instabilities. Data shown are from Bergamaschi et al. (2006) and Kao et al. (2009).