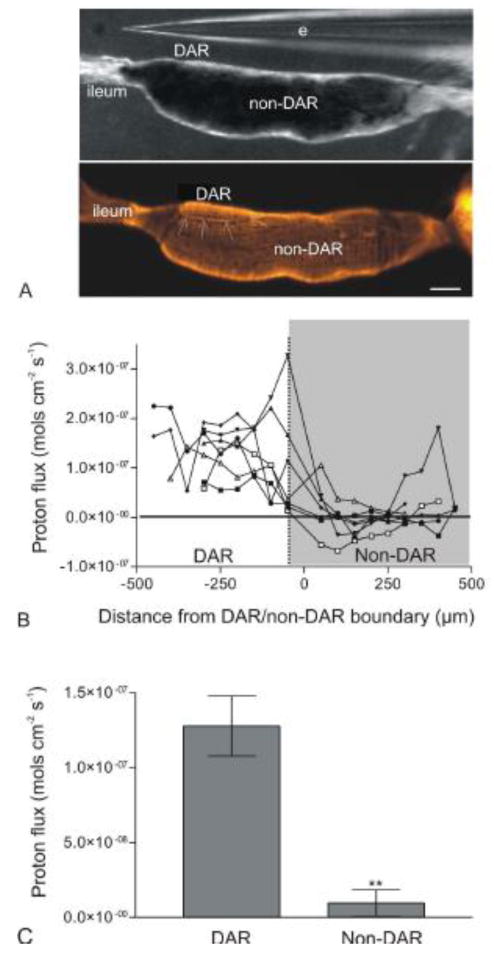
Figure 2.

Measure of proton flux at the basal membrane of the DAR and non-DAR cells of An. albimanus larvae using ISMs in a self-referencing mode. (A) Image illustrating the larval rectum under a light microscope during proton flux measurements (top panel), and post-stained with rhodamine 123 to visualize the DAR/non-DAR boundary (arrows; bottom panel). (B) Proton flux measurements for seven individual preparations (three larvae reared in 2% ASW and four larvae reared in 50% ASW) beginning at the rectum-ileum junction and continuing in 50μm intervals until the end of the rectal cells. Each data point represents an average of continuous measurements taken over a five minute period. There was a consistent, large proton efflux in the area of the DAR cells in all preparations. This efflux dropped drastically, often becoming an influx at the non-DAR cells. (C) Averaged DAR and non-DAR proton flux measurements of the same seven larvae represented in (B). Error bars indicate standard error of the mean. Difference in proton flux between the DAR and non-DAR cells was statistically significant (P-value < 0.01) as determined using a paired t-test and reported as a two-tailed P-value. Scale bar: 100μm. e: electrode. □, ●, ○: larvae reared in 2% ASW; ◆, ▼, ▲, ■: larvae reared in 50% ASW.
