
Figure 4.
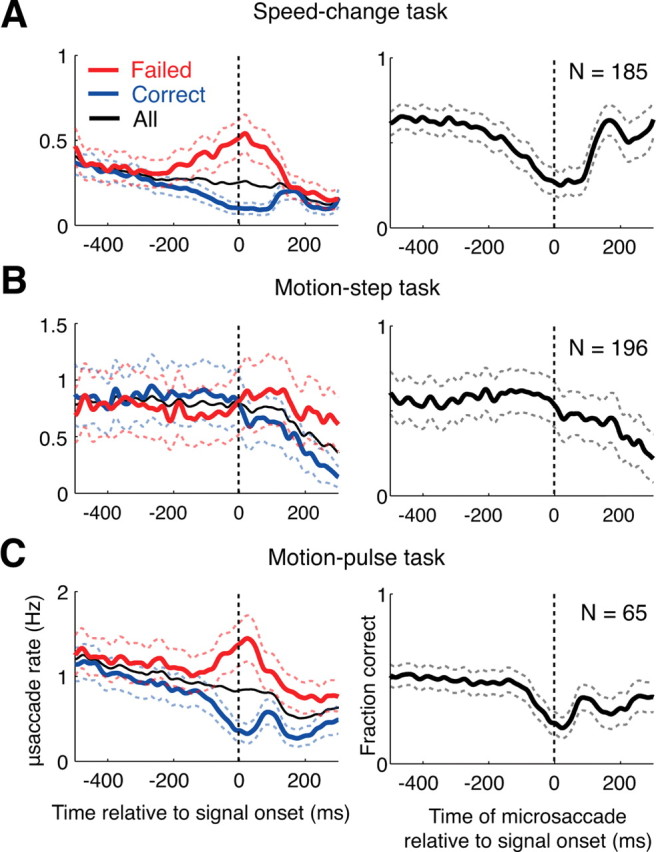
The effect of microsaccades on the monkeys' perception. A, In the left panel, the microsaccade rates for correct trials (blue curve), failed trials (red curve) and all trials (black curve) relative to stimulus onset are shown for the speed-pulse experiment. A greater number of microsaccades occurred around stimulus onset during failed trials. In the right column, we plot the monkey's ability to detect the stimulus as a function of microsaccade time relative to stimulus onset. The panel shows that when a microsaccade occurs near stimulus onset, the ability to correctly detect the stimulus is reduced. B, Same as above, but for the motion-step experiment. Microsaccades after stimulus onset are also associated with a reduction in performance. C, Same as above, but for data pooled from both the 50 and 33 ms motion-pulse experiments. All graphs are averages across experimental sessions. Dashed lines show ±1 SE.