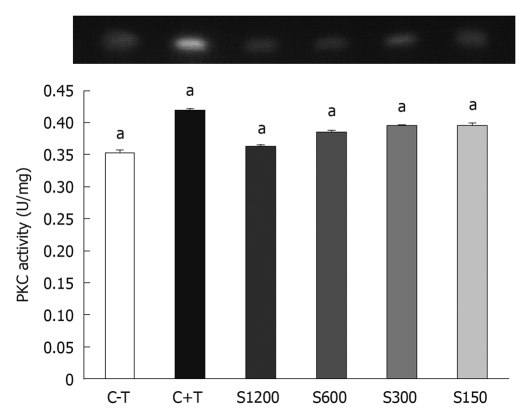
Figure 6.
Effect of extracted crude soybean saponins on protein kinase C activity of WiDr cells. C-T: Untreated control culture for 3 d; C+T: Control culture + 100 ng/mL tetradecanoyl phorbol-13-acetate (TPA); S150: Culture exposed to 150 ppm extracted crude soybean saponins + 100 ng/mL TPA for 3 d; S300: 300 ppm; S600: 600 ppm; S1200: 1200 ppm. Values are mean ± SD. Different concentrations of saponin at each incubation time were compared using one way analysis of variances and Fisher’s least significant difference test. Bars with letter “a” represent significant differences at the P < 0.05 level.

