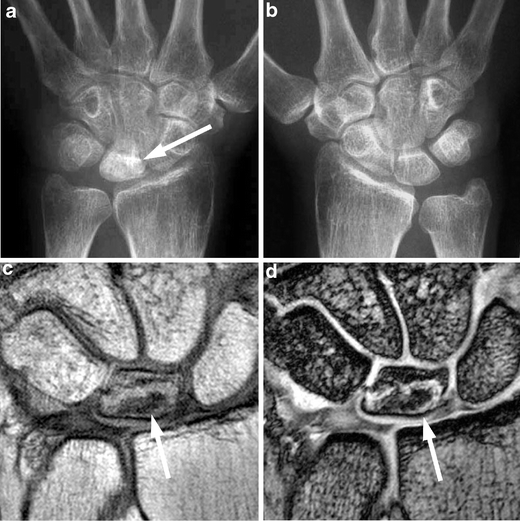
Fig. 6.

Kienböck’s disease. Radiographs of a the affected side (arrow) and b the non-affected side. c Coronal proton-density-weighted (TR/TE = 1,582/15) and d coronal GRE (TR/TE/flip angle = 379/12/40) MR imaging of the wrist in the same patient with Kienböck’s disease demonstrate mixed bone marrow edema and sclerosis with slightly collapsed lunate (arrows)
