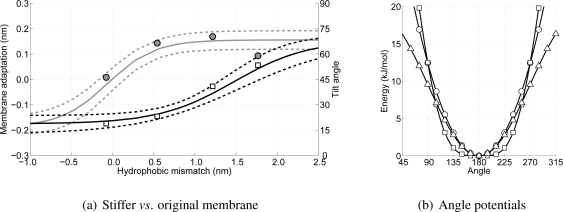
Figure 11.
In (a) the data shown in Figure 10 is repeated using only the sigmoid curves (solid lines). The dotted lines are used to indicate the bandwidth (plus or minus the standard deviation) for both the membrane adaptation (left axis) and the peptide tilt (right axis) as a function of the hydrophobic mismatch. The circles and squares are the values computed from the stiffer membrane. In (b) three lipid tail angle potentials from different CG models are shown (a square denotes Marrink’s model, a triangle Klein’s, and a circle the current model).

