Figure 4.
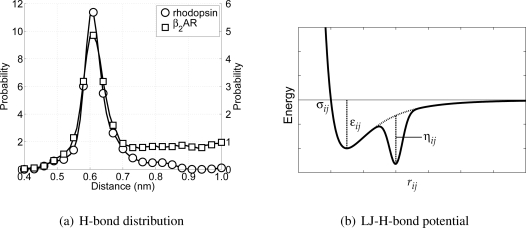
In (a) the distribution of potential H-bonding CG backbone particles along the backbone chain (i to i + 4) is depicted, whereas in (b) the newly developed Lennard-Jones H-bond potential is shown. The dashed line in (b) indicates the curve belonging to a regular Lennard-Jones potential. The important parameters are indicated in the figure.

