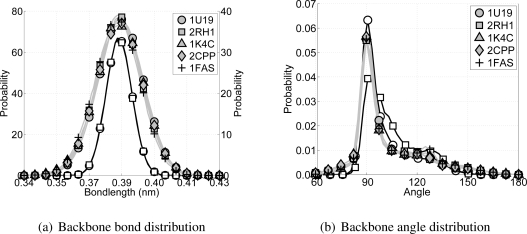
Figure 7.
In (a) the backbone bond distributions for both all-atom simulations (black lines) and the five CG simulations (gray lines) are shown. Using a similar color scheme the backbone angle distributions are shown in (b). The all-atom simulations are on the left axis, and, if applicable, the CG simulations on the right axis. The protein data bank codes for the proteins are used in the legend, see Table 1.

