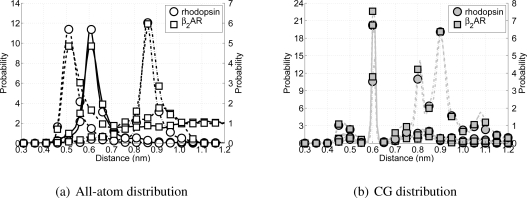
Figure 8.
Distributions of potential H-bond forming pairs in the all-atom simulations (on the left) and in the CG simulations (on the right). For the possible H-bond forming pairs of rhodopsin and the β2AR backbone particles along the chain are considered, where the dashed lines indicate i to i + 3 pairs, solid lines i to i + 4 pairs, and dash-dotted lines i to i + 5 pairs. In the left figure the distribution for β2AR is put on the right y-axis, whereas in the right figure the distributions for the i to i + 5 pairs are on the right y-axis.

