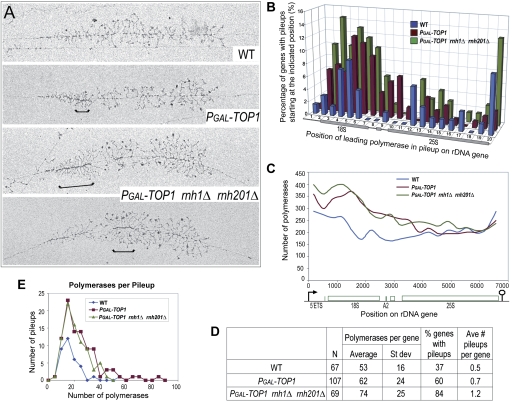
Figure 6.
Polymerase pileups over the 5′-ETS and 18S increase when Top1 and RNase H1 and H201 are absent. (A) Representative rRNA genes from Miller spreads of wild-type, PGAL-TOP1, and PGAL-TOP1 rnh1Δ rnh201Δ strains after 6 h of Top1 depletion in glucose at 30°C. Brackets indicate sites of polymerase pileups. These were defined as at least five tightly packed polymerases. The leading polymerase corresponds to the polymerase situated at the right end of a bracket (Supplemental Fig. S6A). (B) Sites of Pol I pausing across the 35S rDNA gene. The gene was divided into 20 equal segments (∼337 bp each), and the position of the leading polymerase in each pileup was plotted onto the segment in which it occurred. The Y-axis shows the percentage of all rDNA genes for each strain with a pileup starting at the indicated position along the gene (X-axis). All rDNA genes that could be visualized from the 5′ to 3′ ends were included in the analysis, and their lengths were normalized. (C) EM analysis of Pol I occupancy over the rDNA unit. For each of the three strains, polymerase positions were measured along 77 rDNA genes, yielding the position of 15,115 polymerases. Each gene was divided into 20 equal segments, and the number of polymerases in each segment was determined. Data were plotted using the midpoints of the 20 gene segments for positioning on the X-axis using smoothed lines. (D) Total frequencies of pileup occurrence for wild-type and mutant strains. (N) Number of rDNA genes analyzed. The same sample of genes was used in B. (E) Plot of pileup lengths (number of polymerases per pileup) for wild-type and mutant strains. The same sample of genes was used in B.

