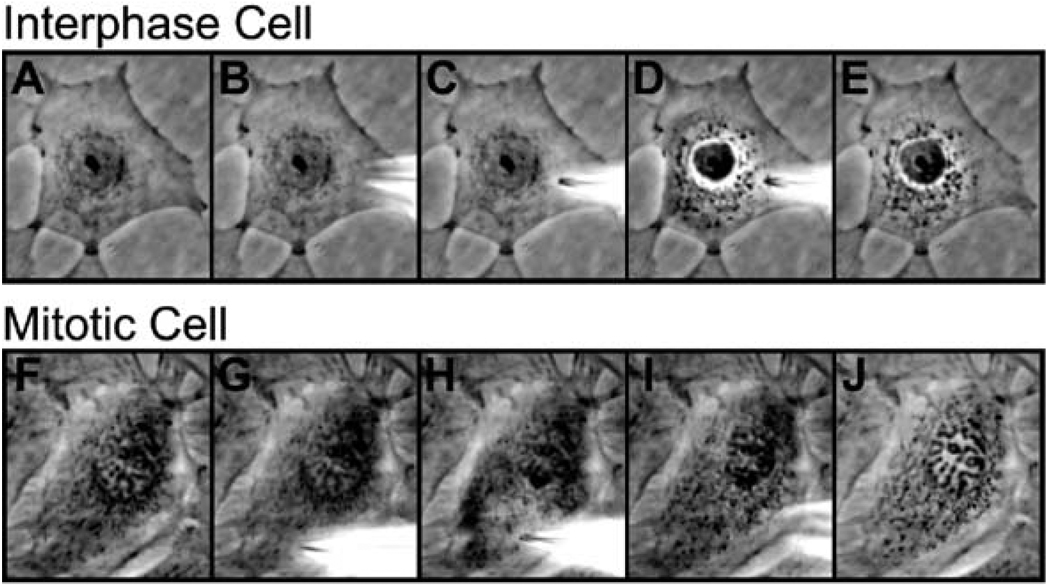
Fig. 7.3. Microinjection of interphase and mitotic PtK2 cells are shown in sequence.
(A) An interphase cell is shown. (B) The same interphase cell is shown with the microinjection tip just out of focus above the cell. (C) The microinjection tip is in focus above the cell prior to injection. (D) As the cell is injected, the injectate can be seen as a wave traveling through the cell. (E) The cell is shown post-injection. (F) A prophase cell is shown with intact nuclear envelope and condensed chromosomes prior to injection. (G) A prophase cell is shown with the microinjection tip just out of focus above the cell. (H) The microinjection tip is in focus above the cell prior to injection at a thick, organelle-rich area, away from the nucleus. (I) As the cell is injected, the injectate can be seen as a wave traveling through the cell. (J) An image of the cell is shown post-injection.

