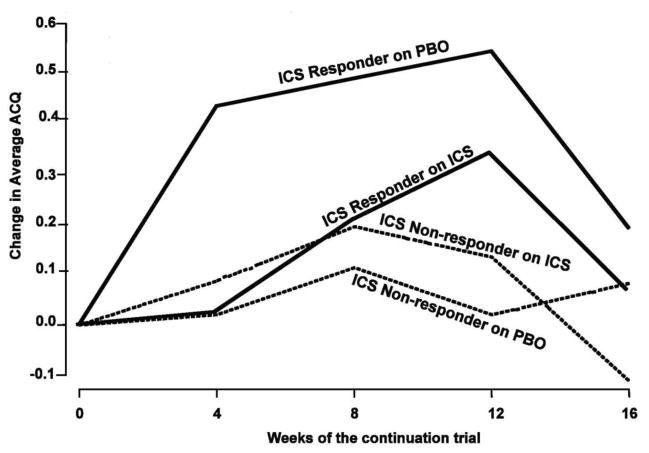
Figure 2.
Asthma control as measured by the ACQ over the 16-week ICS or placebo (PBO) continuation trial. The groups are categorized on the basis of the FEV1 results of the previous 6-week ICS trial: nonresponders ≤5% improvement on ICS; responders >5% improvement on ICS. The only significant within-group difference occurred between PBO and ICS responder groups (P = .007). [Reprinted with permission from Martin RJ et al. J Allergy and Clin Immunol 2007;119:73–80]. Note that a clinically significant change in the ACQ is considered to be 0.5 units.

