
Figure 3.
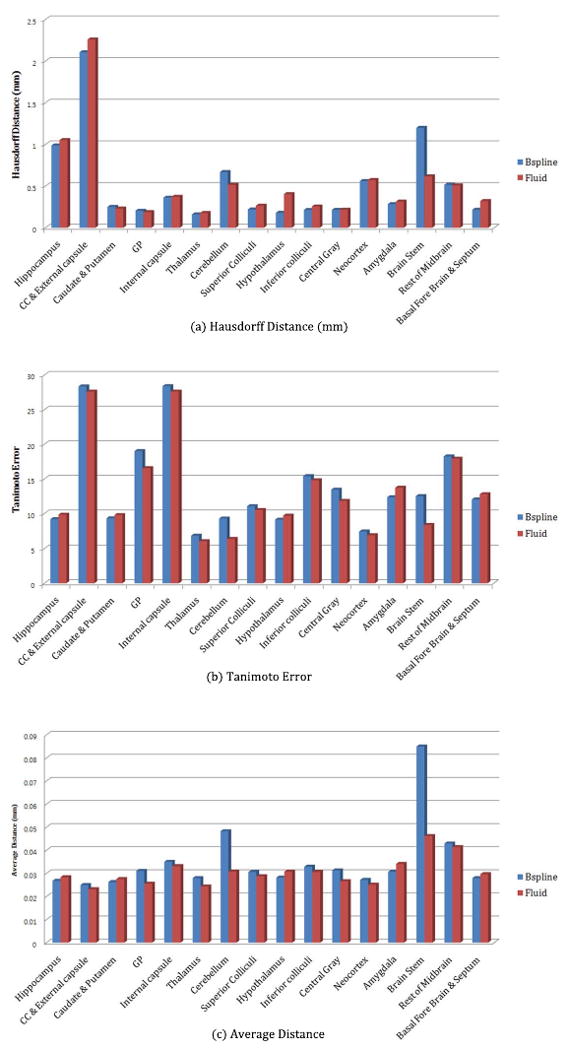
Hausdorff distance, Tanimoto error, and Average distance assessment: Left blue bar is for b-spline registration, and right red bar is the result of fluid registration. Horizontal axis represents the brain structures compared and vertical axis means corresponding measurements. As we see in Figure 3, Bspline registration results for Brain Stem show worse than fluid registration.