
Figure 3.
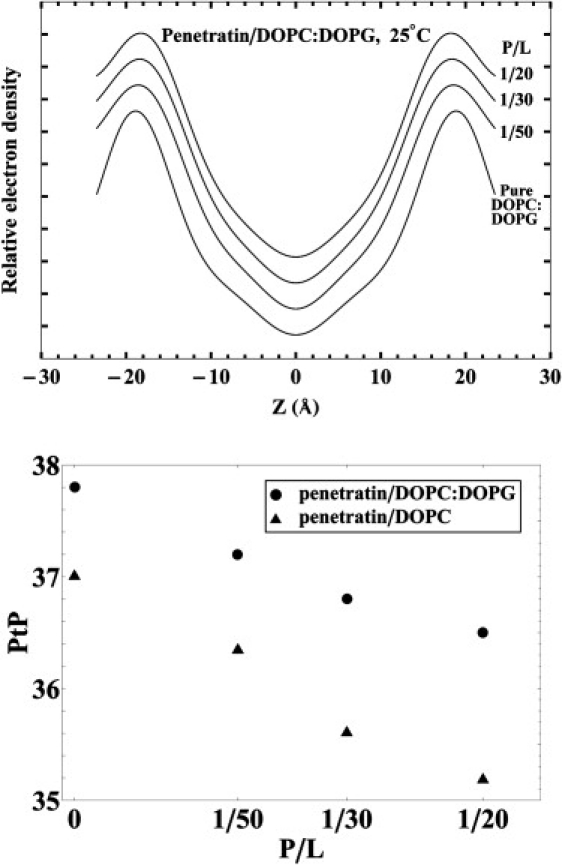
(Top) Electron density profiles across one unit cell obtained from x-ray diffraction for DOPC/DOPG 7:3 with P/L = 0, 1:50, 1:30, and 1:20. (Bottom) The peak-to-peak (PtP) distance of the electron density profile as a function of P/L. The data for DOPC were reproduced from Lee et al. (2) for comparison.