
Figure 4.
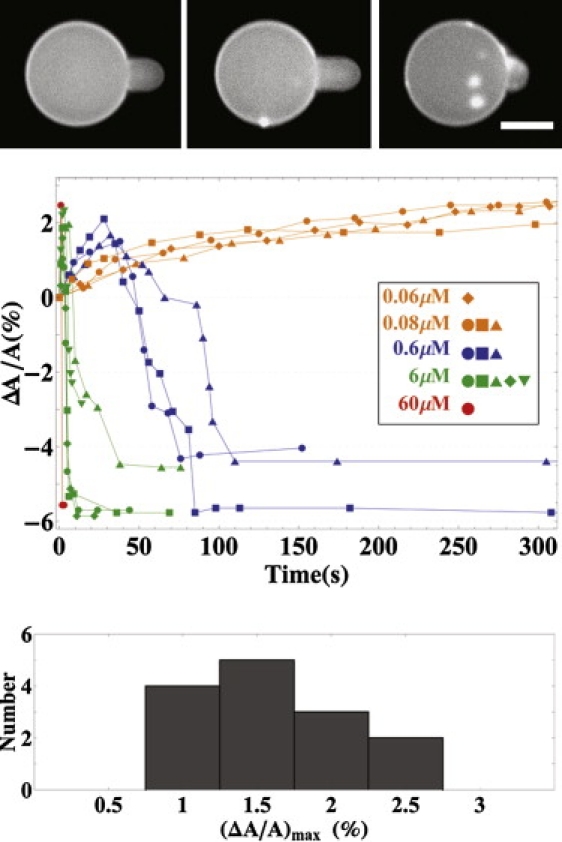
(Top panels) Fluorescence images of a GUV exposed to penetration concentration 0.6 μM in time sequence. (Top, left) For t = 0, the protrusion length was caused by aspiration; thereafter, the pressure inside the micropipette was held constant. (Top, center) For t = 68 s, the protrusion length reached the maximum. (Top, right) For t = 112 s, the protrusion length decreased and aggregates appeared on the GUV surface. (Center panel) The measured protrusion length was converted to the fractional area change ΔA/A plotted versus time for representative runs at penetratin concentrations ≥0.6 μM or ≤0.08 μM. (Bottom panel) Histogram for the maximum values of ΔA/A among 14 high concentration runs (≥0.6 μM). Each column represents the number of runs with the maximum value of ΔA/A falling in the range indicated by the x axis. The scale bar = 20 μm.