
Figure 3.
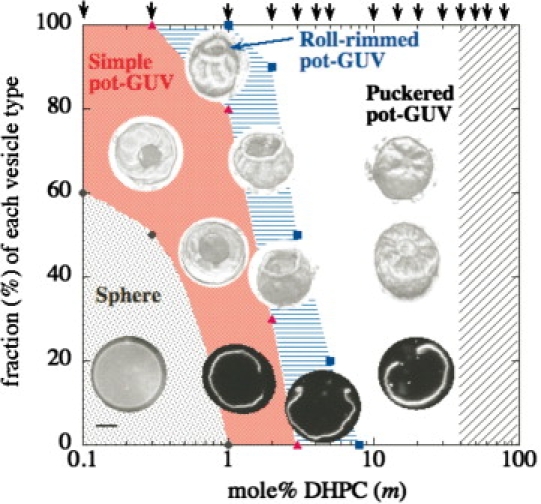
Morphology diagram of DHPC/DPPC pot-GUVs at 25°C as a function of DHPC mole fraction m, with typical fluorescence microscope images (the scale bar indicates 5 μm). The vertical axis represents the fraction of each morphology and arrows at upper axis indicate examined DHPC mole %. Circles, triangles, and squares indicate observed borders between spheres/simple pot-GUVs, simple/roll-rimmed pot-GUVs, and roll-rimmed/puckered pot-GUVs, respectively. In the shaded region, the binary lipids could not form GUVs.