
Figure 3.
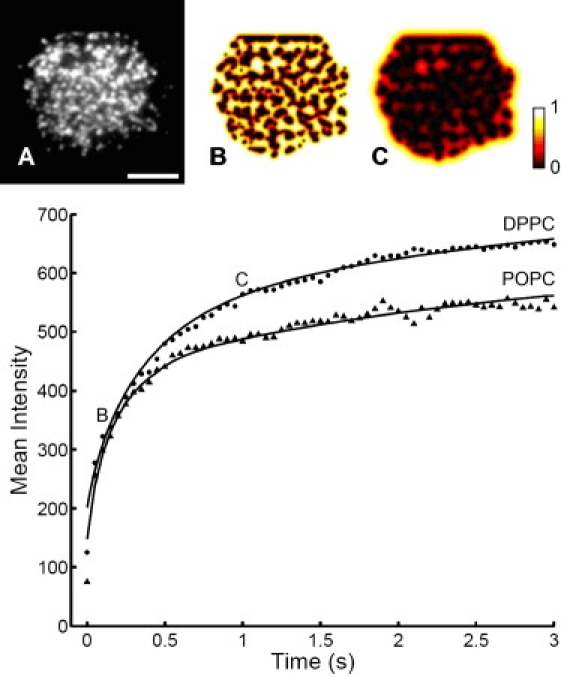
Mean receptor cluster intensity is used as a measure of number of receptors trapped in cell protrusions by immobile (DPPC) or mobile (POPC) ligands. The data was fit to a numerical 2D diffusion trapping model. The extracted diffusion coefficients for cells shown here are 0.16 μm2/s and 0.26 μm2/s for DPPC and POPC respectively. (The differences in overall intensities likely reflect cell to cell receptor number variations, and were not consistently different for mobile versus immobile bilayers.) Top images depict (A) analyzed cell on DPPC bilayer and evolved free receptor concentration after (B) 0.16 s and (C) 1 s. Scale bar = 5 μm.