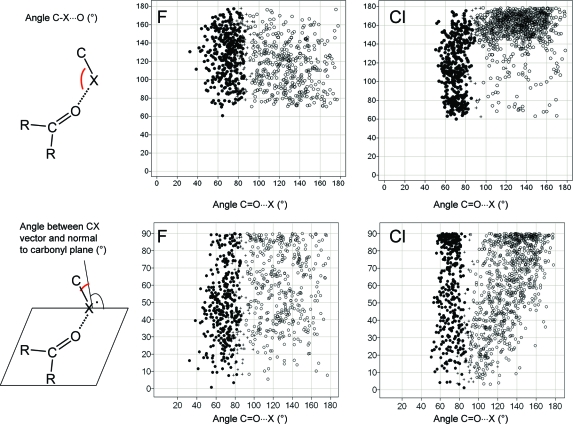
Figure 12.
Occurrence of close contacts between F (left) and Cl (right) atoms and carbonyl groups in the CSD. Scatter plots show two different angle distributions. Points are categorized by their distance to the carbon and oxygen atoms of the C=O unit: (●) close contact between halogen and carbonyl C (<3.3 Å for F, <3.5 Å for Cl); (○) close contact between halogen and carbonyl O (<3.1 Å for F, <3.3 Å for Cl); (+) both close contact criteria satisfied.

