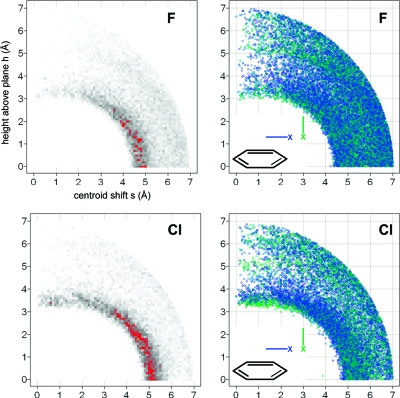
Figure 14.
Radial distribution of fluorine atoms (top) and chlorine atoms (bottom) around phenyl rings (CSD statistics). Darker gray corresponds to higher density; peaks above a numerical value of 90 are colored red. Scatter plots of all hits for fluorine and chlorine (right-hand side) are colored by the angle between the phenyl plane and the C−X vector from blue (0°, in plane) to green (90°, orthogonal).

