
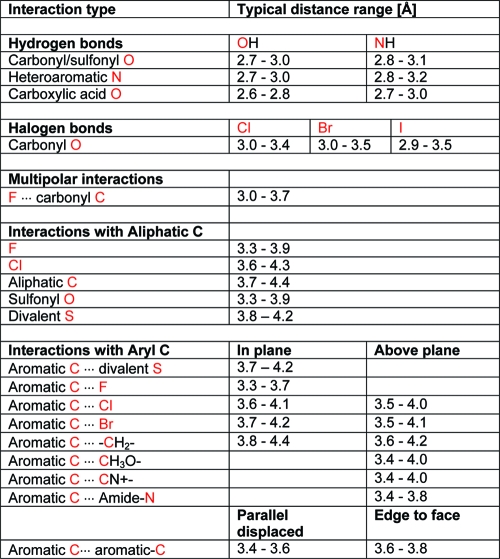
Table 2. Summary of Typical Interaction Distances of Selected Noncovalent Interactionsa.
 |
a
Distance values are given as the lower and upper 90% percentiles of the corresponding histogram peak extracted from CSD searches. Interactions are formed with the atoms highlighted in red. In the case of aryl carbon atoms, the closest distances observed were chosen.