Figure 2.
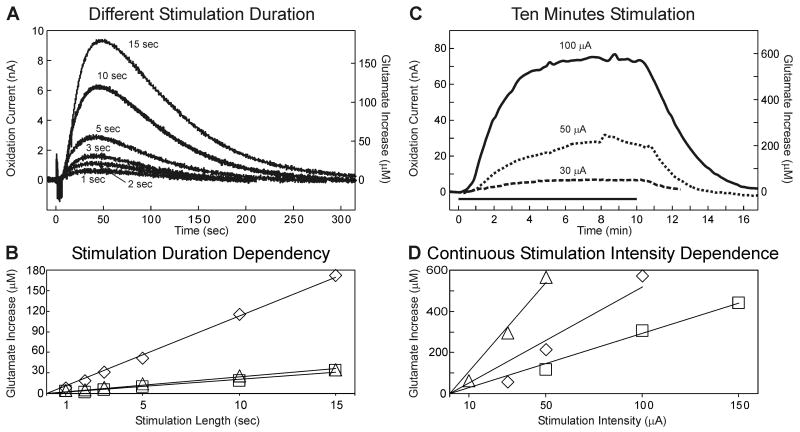
Stimulation Duration Dependency. (A): Evoked glutamate release in the thalamus of one rat at different monophasic stimulation durations (current intensity and pulse width held constant: 0.2 mA, 100 Hz, 100 μs). (B): Peak magnitudes in thalamic glutamate extracellular concentrations obtained at varying monophasic stimulation durations (n=3 rats). Different symbols represent measurements obtained from separate animals. Black lines represent best fit for a given animal. (C): Thalamic glutamate release obtained from one rat during 10 min of monophasic stimulation at a fixed frequency and pulse width (100 Hz, 100 μsec). The black line above the x-axis represents the 10 min period of stimulation. (D): Peak magnitudes of thalamic glutamate extracellular concentrations obtained with 10 min monophasic stimulation (100 Hz, 100 μsec) and varying stimulation intensity in three rats. Different symbols represent measurements obtained from separate animals. Black lines represent best fit for a given animal.

