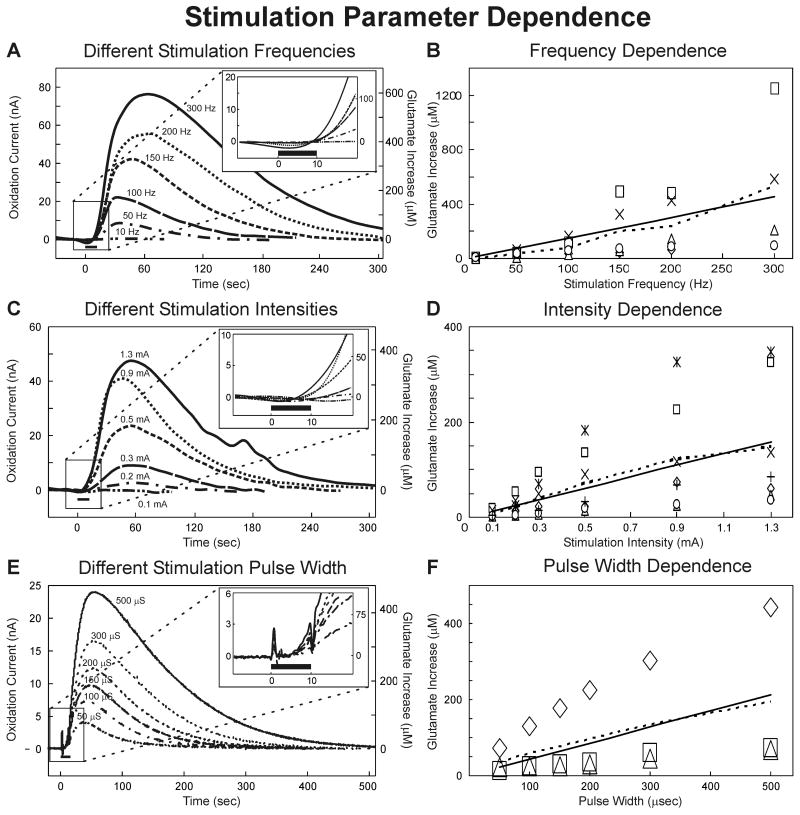
Figure 3.
Stimulation Parameter Dependence. (A): Evoked glutamate release in the thalamus of one rat at different monophasic stimulation frequencies (10-300 Hz) with current intensity and pulse width held constant (0.5 mA, 100 μsec). The inset shows the initial phase of the response around the 10 sec (black bar) stimulation period. (B): Peak magnitudes in thalamic glutamate extracellular concentrations elicited at each test stimulation frequency (n=5 rats). The dashed line is the average and solid line the linear regression (r2 =0.907). (C): Evoked glutamate release in the thalamus of one rat at different monophasic stimulation intensities (0.1-1.3 mA) with frequency and pulse width held constant (100 Hz and 100 μsec). The inset shows the initial phase of the response around the 10 sec (black bar) stimulation period. (D): Peak magnitudes in thalamic glutamate extracellular concentrations elicited at each test stimulation current intensity (n=7 rats). The dashed line is the average and solid line the linear regression (r2 =0.97). (E) Evoked glutamate release in the thalamus of one rat at different monophasic stimulation pulse widths (50-500 μsec) with frequency and current intensity held constant (100 Hz, 0.2 mA). The inset shows the initial phase of the response around the 10 sec (black bar) stimulation period. (F) Peak magnitudes in thalamic glutamate extracellular concentrations elicited at each test stimulation pulse width (n=3 rats).

