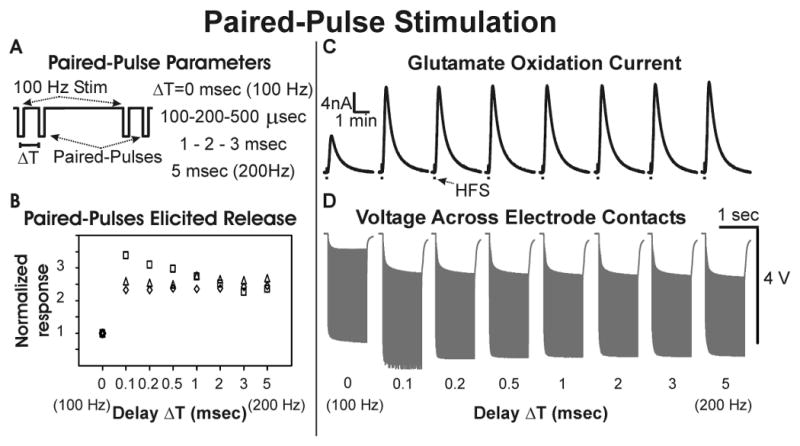
Figure 6.

Paired-Pulse Stimulation. (A): Schematic representation of paired-pulse stimulation with a 100 Hz stimulation interleaved with paired pulses at an interpulse delay of ΔT (0.1-5 msec). (B): Peak thalamic glutamate response elicited with different interpulse delays relative to the the peak glutamate response (set at 1) obtained with 100 Hz stimulations at ΔT=0 (n=3 rats). (C): Thalamic glutamate release elicited at different interpulse delays in one rat (0.1 mA, 100 μs pulse width). (D): Voltage measured across electrode contacts during paired-pulse stimulations.
