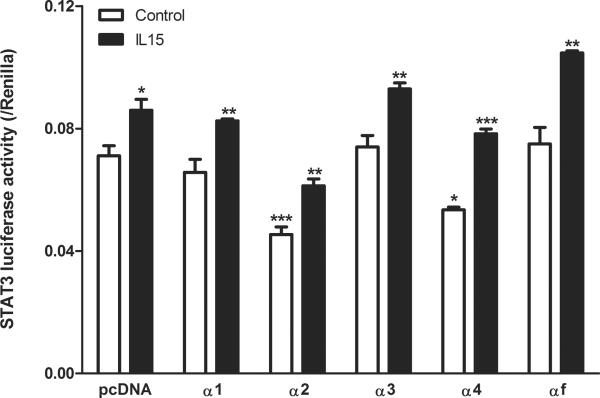
Fig 5.
STAT3 activation in RBE4 cells measured by luciferase reporter assay (n = 4 /group). The basal STAT3 activity was high. It was not affected by variant α1, α3, and αf, but decreased by variants α2 and α4. IL15 (100 ng/ml) for 6 h increased STAT3 activity in all groups. In comparison with the pcDNA control, α2 transfected cells showed a lower level of STAT3 activation whereas αf transfected cells showed a greater increase. Asterisks over the vehicle-treated cells (clear bar) show differences in comparison with the pcDNA group. Asterisks over the IL15-treated cells (solid bar) show differences of the particular isoform with vehicle treated control. *: p < 0.05; **: p < 0.01; ***: p < 0.005.

