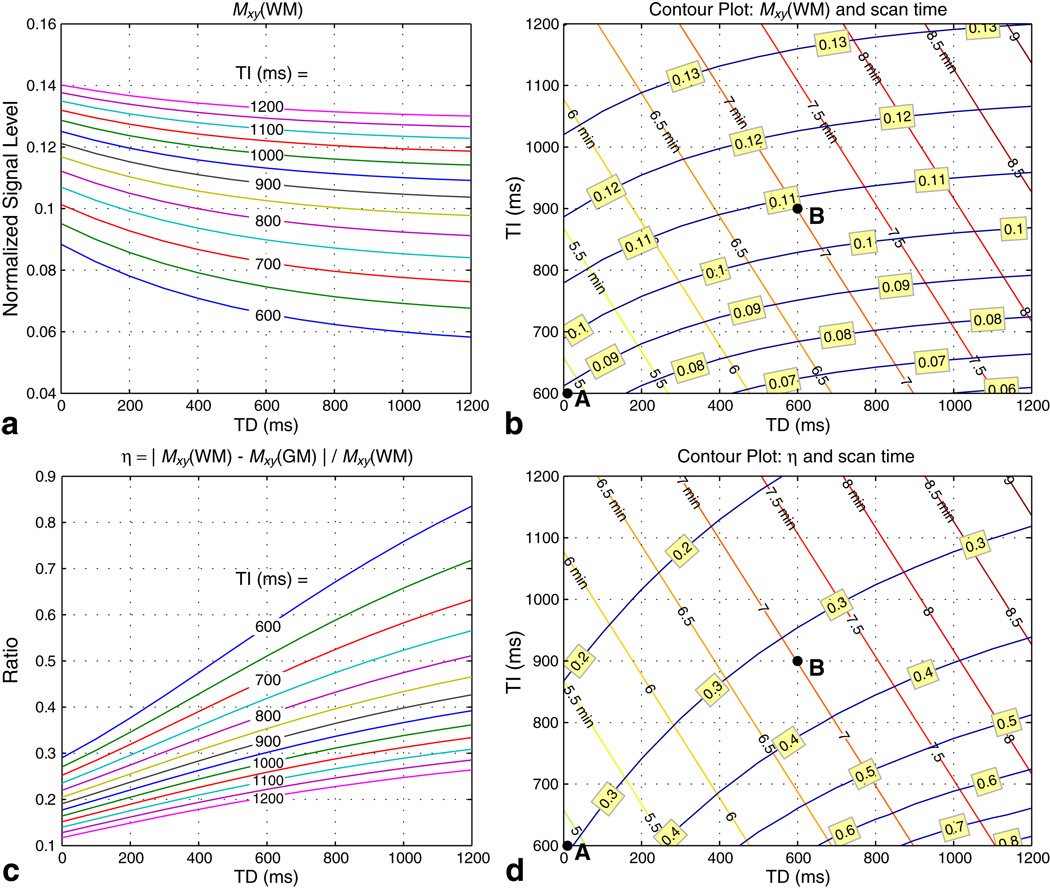
FIG. 5.
Contour plots of sequence trade-offs. Bloch simulations were performed for TI = 600–1200 ms (in steps of 50 ms) and TD = 0–1200 ms (in steps of 100 ms) with Q/TE/TR/θ = 120/2 ms/12 ms/15°. Signal levels for WM and GM from the first encoding step of the readout segment were recorded. Mxy(WM) is proportional to SNRWM (a, b), while the contrast efficiency η = |Mxy(WM) − Mxy(GM)|/Mxy(WM) is proportional to CNR/SNRWM (c, d). Contour plots (b) and (d) include the scan time Tscan required for whole-brain coverage for each combination of TI and TD. Two protocols were chosen to balance SNR, CNR, and scan time: protocol A (TI/TD = 600/0 ms, Tscan = 4 min 52 s) is a fast scan while protocol B (TI/TD = 900/600 ms, Tscan = 7 min) achieves higher SNR. Both protocols theoretically achieve η on the order of 30%.

